

Why Understanding Google Ads Metrics and Dimensions Can Make or Break Your Ad Spend

Google Ads metrics and dimensions are the two core data types in every Google Ads report, and knowing the difference is the fastest way to stop wasting ad budget.
Here’s the quick answer:
| Metrics | Dimensions | |
|---|---|---|
| What it is | A number that measures performance | A label that describes what was measured |
| Examples | Clicks, CTR, CPC, ROAS, Conversions | Campaign, Device, Location, Ad Group, Keyword |
| Used for | Tracking results | Slicing and filtering data |
| Think of it as | The score | The category |
In short: dimensions tell you where or what, metrics tell you how well.
Most businesses running Google Ads are swimming in data but still flying blind. They see numbers, clicks, impressions, cost, but they don’t know which campaigns, devices, or audiences are actually driving results. That’s the gap metrics and dimensions together are designed to close.
I’m Lior Krolewicz, a former Special Ops commander turned Google Ads specialist, and I’ve spent 15+ years using Google Ads metrics and dimensions to help businesses stop bleeding ad dollars and start scaling profitably. In this guide, I’ll break down exactly which numbers matter, how to segment them correctly, and how to turn raw reporting data into real decisions.
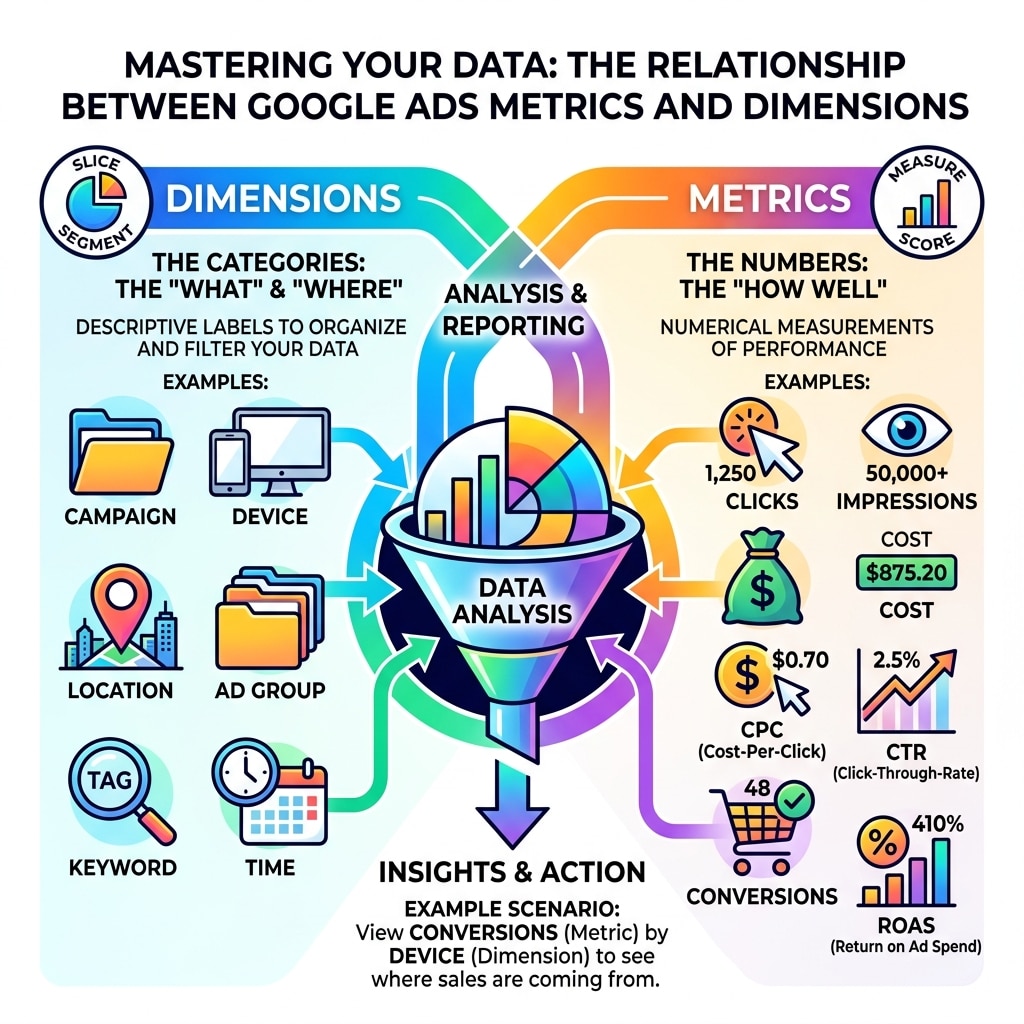
Google ads metrics and dimensions terms to know:
Understanding the Core: Google Ads Metrics and Dimensions Explained

To master your account, we first need to define our building blocks. Think of your Google Ads data like a giant spreadsheet. The dimensions are the rows that describe your business elements, and the metrics are the numbers filling the cells.
According to official Google documentation on metrics and dimensions, dimensions are the qualitative attributes of your data. They are the “things” you are measuring—like which advertiser is running the ad, which creative is being shown, or what the ad type is.
Metrics, on the other hand, are the quantitative measurements. These are standard units of measure applied to your campaigns. If you have a dimension called “Campaign Name,” the metrics tell you how many clicks or how much money that specific campaign name generated.
| Feature | Metrics | Dimensions |
|---|---|---|
| Data Type | Quantitative (Numbers) | Qualitative (Attributes/Labels) |
| Function | Measuring performance | Segmenting and organizing data |
| Examples | Clicks, Conversions, Cost | Campaign, City, Device, Day of Week |
| Reporting Role | Values in the columns | Row headers or filters |
Key Differences in Reporting Data
The primary difference lies in the granularity of your reporting. Dimensions allow for data segmentation—breaking down a big number into smaller, more meaningful pieces. For example, knowing you had 100 conversions is great (that’s a metric). But knowing that 80 of those conversions came from mobile devices and 20 from desktops (that’s the “Device” dimension) is actionable intelligence.
When asking what metrics should I be looking at?, the answer always depends on the dimension you’ve selected. A high CPC might be acceptable for a “High Intent” keyword dimension but disastrous for a “Brand Awareness” campaign dimension.
How Dimensions Function as Filters
In the Google Ads Report Builder, dimensions serve a dual purpose: they act as column headings to sort your data, and they act as powerful filters. By applying a dimension as a filter, you can limit your report to specific elements—like viewing data only for a specific geographic region or a certain ad group.
As noted in the Metrics and Dimensions API documentation, some dimensions like “Date” are unique. While you use date to sort data, the actual date range is usually set by a separate calendar tool rather than a standard filter. Most other dimensions, however, are your primary tools for “slicing and dicing” your account to find where the profit is hiding.
Essential Google Ads Metrics for Performance Tracking
If you want to scale, you have to know your numbers. We focus on the “Big Four” metrics that tell the real story of your account’s health.
- Click-Through Rate (CTR): This measures how often people who see your ad end up clicking it. It’s the ultimate indicator of relevance. Why is CTR important? Because a high CTR tells Google your ad is helpful, which can lower your costs. If yours is low, you need to learn how to improve your CTR.
- Cost Per Click (CPC): This is the average amount you pay for each click. It’s a measure of efficiency and competition.
- Conversion Rate: The percentage of clicks that resulted in a desired action (like a sale or a lead). This tells you if your landing page is doing its job.
- Return on Ad Spend (ROAS): The holy grail. This is the total conversion value divided by the total cost.
Calculating Key Google Ads Metrics and Dimensions
Understanding the math behind these google ads metrics and dimensions is crucial for conducting a deep Google Ads analysis.
- CTR Formula: (Clicks / Impressions) x 100
- Conversion Rate Formula: (Conversions / Clicks) x 100
- ROAS Formula: Total Conversion Value / Total Cost (can be expressed as a ratio or a percentage)
- Interaction Rate: Similar to CTR, but used for non-search formats (like video views or engagements).
Advanced Video and Display Network Metrics
When we move away from Search and into the Display and Video networks, the metrics change to reflect user behavior. We use Active View metrics to determine viewability. A “Viewable Impression” is counted when at least 50% of your ad is on screen for at least one second (for Display) or two seconds (for Video).
For video, we also track:
- Quartile Completions: What percentage of users watched 25%, 50%, 75%, or 100% of your video?
- Audibility: Was the sound on when the video played?
- View Rate: The number of views or engagements divided by the number of impressions.
These advanced analytics metrics help us understand if people are actually consuming your content or just scrolling past it.
Segmenting Success with Reporting Dimensions
Dimensions are where the “detective work” happens. By looking at metrics through the lens of different dimensions, we can perform a thorough Google Ads account audit.
- Geography: Are you profitable in New York but losing money in Los Angeles? Segmenting by City, State, or Zip Code reveals regional performance gaps.
- Device Type: Users behave differently on mobile vs. desktop. Often, mobile has a higher CTR but a lower conversion rate.
- Ad Network: This dimension separates performance on Google Search from the Search Partners or the Display Network.
Analyzing Google Ads Metrics and Dimensions by Attribution
One of the most confusing aspects of google ads metrics and dimensions is when the data is recorded. Google provides two main ways to look at this:
- Click Time: Conversions are recorded on the day the click happened. This is the standard for most reports.
- Conversion Time: Conversions are recorded on the day the actual purchase occurred.
This distinction is vital when using different attribution models in Google Ads. If a user clicks on Monday but buys on Friday, “Click Time” reporting puts that success on Monday’s tab.
Combining Dimensions for Deeper Insights
The real magic happens when you combine dimensions. For example, looking at the “Search Term” dimension combined with the “Match Type” dimension. This shows you exactly what people typed into Google and how closely it matched your targeted keyword.
We also look at Session-matched dimensions vs. Shared dimensions. When we use Google Analytics effectively, we can see how specific Google Ads dimensions (like Campaign Name) correlate with website behavior (like Session Duration).
Optimizing Visibility with Impression Share and Quality Score
Are you leaving money on the table? Impression Share metrics tell you what percentage of the total available market you are actually reaching.
- Search Impression Share: The impressions you received divided by the estimated number of impressions you were eligible to receive.
- Lost IS (Budget): The percentage of time your ad didn’t show because you ran out of money.
- Lost IS (Rank): The percentage of time your ad didn’t show because your Ad Rank was too low.
To fix “Lost IS (Rank),” we look at your Quality Score breakdown. Quality Score is a diagnostic tool that measures the relevance of your ad, keyword, and landing page. A higher Quality Score leads to lower costs and better ad positions.
Frequently Asked Questions about Google Ads Reporting
What is the difference between ‘Conversions’ and ‘All Conversions’?
“Conversions” only includes the actions you’ve marked as “Primary” (the ones you want the bidding algorithm to optimize for, like a purchase). “All Conversions” includes everything: primary actions, secondary actions (like newsletter signups), and even local actions like “calls from ads” or “store visits.”
How do I combine Google Ads metrics and dimensions with other platforms?
If you are using a platform like Piwik PRO, you must follow specific compatibility rules. You can generally combine shared dimensions (like Date or Device) with any metric. However, session-matched dimensions (like Ad Group ID) must be paired with session-level metrics to ensure the data aligns correctly.
Why can ‘All Conversions Rate’ exceed 100%?
This happens because a single ad interaction (click) can lead to multiple conversions. If a user clicks your ad once and then proceeds to download three different whitepapers, you have one interaction and three conversions—resulting in a 300% conversion rate for that session.
Conclusion
Mastering google ads metrics and dimensions isn’t about memorizing a dictionary; it’s about knowing how to ask the right questions. When you stop looking at your account as a single “blob” of cost and start seeing it as a collection of segments—some profitable, some wasteful—you gain the power to grow.
At Yael Consulting, we’ve spent over 15 years helping businesses in the USA, Israel, New York, and Los Angeles navigate these complexities. We don’t just report numbers; we find the profit hidden within them.
Ready to see what’s really happening under the hood of your account? We offer a free, actionable 15-minute Google Ads analysis where we’ll personally walk you through your data and show you exactly where you’re losing money.