
Why Google Ads Metrics Explained Correctly Can Make or Break Your Ad Budget

Google Ads metrics explained simply: they are the performance indicators that tell you whether your ad spend is working or wasting money. Here are the core metrics you need to know:
| Metric | What It Measures |
|---|---|
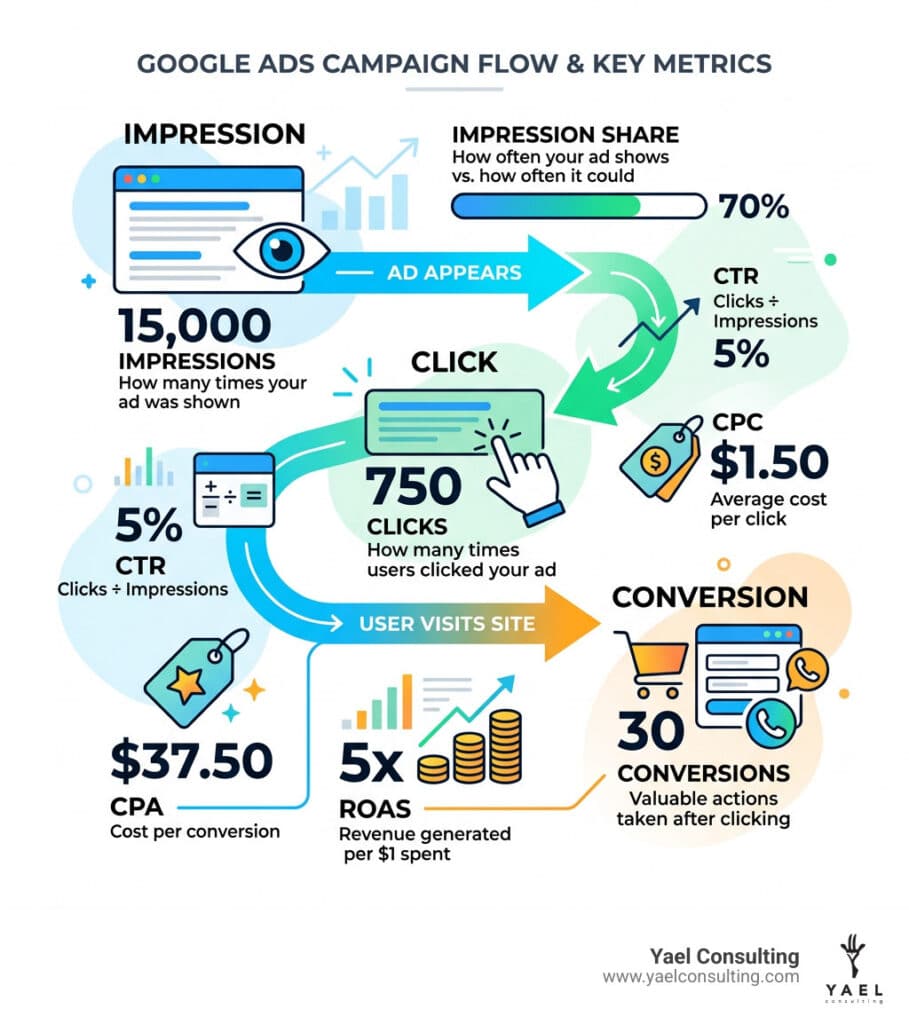
| Impressions | How many times your ad was shown |
| Clicks | How many times users clicked your ad |
| CTR | Clicks ÷ Impressions (ad relevance signal) |
| CPC | Average cost per click |
| Conversions | Valuable actions taken after clicking |
| CPA | Cost per conversion |
| ROAS | Revenue generated per $1 spent |
| Quality Score | Google’s 1–10 rating of your ad relevance |
| Impression Share | How often your ad shows vs. how often it could |
Roughly 98% of digital marketers run Google Ads campaigns. Yet most struggle to make sense of the data staring back at them from their dashboards. Numbers pile up fast, impressions, Quality Scores, impression share, conversion values, and it’s easy to focus on the wrong ones while your budget quietly drains away.
The good news? You don’t need to track everything. You need to track the right things for your goal.
I’m Lior Krolewicz, a Google Ads expert with 15+ years of experience helping businesses stop wasting ad spend and start scaling profitably, and understanding google ads metrics explained correctly is always the first step I take when auditing any account. This guide will walk you through every metric that matters, so you can make smarter decisions with your budget starting today.
Google ads metrics explained terms to learn:
Foundational Google Ads Metrics Explained
When we first open a client’s account, we look at the “Core Four.” These are the building blocks of every campaign. If you don’t understand these, the more advanced data won’t make any sense.
| Metric | Significance | Action if Low |
|---|---|---|
| Impressions | Brand visibility and reach | Increase budget or broaden keywords |
| Clicks | User interest and traffic | Improve ad copy or offer |
| Cost | Budget management | Adjust bids or pause poor keywords |
| CTR | Ad relevance and health | Improve your CTR with better headlines |
The amount you actually pay for these interactions is dictated by your ad rank. In the Google auction, you only pay the minimum amount required to beat the competitor immediately below you. This means that even with a high bid, a high-quality ad can often cost you less than a poor-quality ad from a competitor.
Interpreting Google Ads Metrics Explained for Beginners
For those just getting started, let’s break down the definitions:
- Impressions: Every time your ad appears on a search results page or the Google Network, it counts as one impression. It doesn’t mean someone looked at it; it just means it was served.
- Clicks: This is when a user actually interacts with your ad. Clicks are the starting point of user interest.
- Total Cost: The sum of what you’ve spent over a specific timeframe.
- Average Cost Per Click (CPC): Calculated as (Total Cost ÷ Total Clicks). This tells you the average price of a single “visit” to your site.
- Click-Through Rate (CTR): This is a vital health check. The formula is (Clicks ÷ Impressions) x 100.
Why is CTR so important? It tells us if your ad is relevant to the user’s intent. If 1,000 people see your ad but only 5 click it (0.5% CTR), Google assumes your ad isn’t very helpful, which can negatively impact your costs.
Visibility and Impression Share
Sometimes you might wonder, “Why isn’t my ad showing every time someone searches for my keyword?” This is where Impression Share (IS) comes in. It is the percentage of impressions you received divided by the estimated number of impressions you were eligible to receive.
- Search Impression Share: If your IS is 75%, it means your ad appeared 3 out of every 4 times it could have.
- Lost IS (Budget): This tells you how often your ad didn’t show because you ran out of money. If this is high, you are leaving money on the table.
- Lost IS (Rank): This tells you your ad didn’t show because your Ad Rank (bid + quality) was too low.
To see how you stack up against the “big guys,” we use Auction Insights. This report reveals which competitors are appearing in the same auctions as you and how often they outrank you.
Conversion and Profitability Metrics
Traffic is great, but profit is better. To see if your ads are actually making money, you must set up conversion tracking. A conversion is any valuable action a user takes—like a purchase, a form fill, or a phone call.
Measuring Success with Conversions
Once tracking is live, we look at:
- Conversion Rate (CVR): (Conversions ÷ Clicks) x 100. If 100 people click and 5 buy, your CVR is 5%. If this is below 0.5%, we usually look at the landing page experience as the culprit.
- Cost Per Acquisition (CPA): (Total Cost ÷ Total Conversions). This is what you pay to “buy” a customer. For a photographer, a conversion might be a phone call. For an e-commerce store, it’s a sale.
- Total Conversion Value: The total dollar amount generated by your conversions.
Understanding attribution models is also key here. An attribution model decides how much credit each click gets for a final sale. For example, if a user clicks a Search ad, then a Remarketing ad, and then buys, who gets the credit? Choosing the right model ensures your conversion tracking data reflects reality.
Advanced Google Ads Metrics Explained for Scaling
When you’re ready to scale, you need to look at Return on Ad Spend (ROAS). This is the “Gold Standard” of profitability.
The ROAS Formula: (Total Conversion Value ÷ Total Cost). If you spend $500 and generate $3,000 in revenue, your ROAS is 6 (or 600%). This means you generate $6 for every $1 spent.
At Yael Consulting, we often tell clients to look at specific metrics like Conversion Value / Cost to determine which products or services are truly driving the bottom line. We also track View-through conversions (VTC), which happen when someone sees your ad, doesn’t click, but later converts on your site. This is common in Display and Video campaigns.
Quality and Ad Performance Indicators
Google isn’t just a vending machine where you put in money and get clicks. It’s a relevance engine. To keep users happy, Google rewards high-quality ads with lower prices.
The Power of Quality Score
Quality Score is a 1–10 rating that acts as Google’s verdict on your ads. It is made up of three parts:
- Expected CTR: How likely Google thinks people are to click.
- Ad Relevance: How well your ad matches the user’s search term.
- Landing Page Experience: How useful and fast your website is.
A high Quality Score can lead to a significant reduction in your CPC. If your score is a 10, you might pay 50% less than someone with a score of 5 for the same position!
Ad Rank and Auction Dynamics
Your Ad Rank determines your ad’s position. It is calculated using your bid, your Quality Score, and the expected impact of your ad assets (like sitelinks).
To stay competitive, we regularly perform a deep Google Ads analysis and dive into the search terms report. This report shows the actual words people typed before seeing your ad. If you see irrelevant terms, you add them as “Negative Keywords” to stop wasting money. Learning how to view this report is one of the fastest ways to save your sanity and your budget.
Campaign-Specific and Engagement Metrics
Not all campaigns are built the same. If you are running a YouTube ad, a click might not be your primary goal—a “view” might be.
Video and Display Engagement
For Video campaigns, we track:
- View Rate: The percentage of people who watched your video when it was served.
- Watch Time: Total time users spent watching your video ads.
- Engagement Rate: For Display, this tracks interactions like expansions or lightboxes.
We also use the Google Mobile-Friendly Test to ensure that the traffic we are buying isn’t bouncing because the site looks terrible on a phone.
Performance Max and Discovery Metrics
Performance Max (PMax) is a newer, AI-driven campaign type. Because it’s a “black box,” we have to look at Asset Group reporting to see which headlines and images are performing best.
To get the full story, we always recommend you link your Google Ads and Analytics accounts. This allows you to see what users do after the click—how long they stay on the site and which pages they visit. It’s also where you can track mobile app conversions or phone call conversions more effectively.
Frequently Asked Questions about Google Ads Metrics
What is a good ROAS for Google Ads?
A “good” ROAS depends on your profit margins. However, a common benchmark is 4:1 ($4 revenue for every $1 spent). If your margins are thin, you might need a 10:1 to be profitable. At Yael Consulting, we focus on profitable scaling, not just hitting a random number.
How does Quality Score actually lower my CPC?
Google uses a formula: (Ad Rank of person below you / Your Quality Score) + $0.01. Because Quality Score is the denominator, a higher score mathematically lowers the price you have to pay to maintain your position.
What is the difference between Search Top IS and Absolute Top IS?
- Search Top IS: The percentage of impressions where your ad appeared anywhere above the organic search results.
- Search Absolute Top IS: The percentage of impressions where your ad was the very first ad at the top of the page.
Conclusion
Understanding google ads metrics explained is the difference between “guessing” and “growing.” You don’t need to be a math genius to succeed, but you do need to focus on the metrics that tie directly to your business goals—whether that’s awareness, leads, or pure e-commerce sales.
At Yael Consulting, we’ve spent over 15 years mastering these numbers. We are a boutique agency that offers one-client-per-market exclusivity, meaning we don’t work with your competitors. Our CEO is directly involved in every account because we believe that high-level expertise shouldn’t be reserved for just the biggest spenders.
If you’re tired of looking at your dashboard and feeling overwhelmed, let us help. We offer a free, actionable 15-minute Google Ads analysis where we will dive into your metrics and show you exactly where you’re wasting money and where you can grow.
Get expert help with our Google Ads Management Services and let’s turn those confusing numbers into real profit.